MR Spectroscopy (MRS) Made Easy
Last updated October 22, 2026
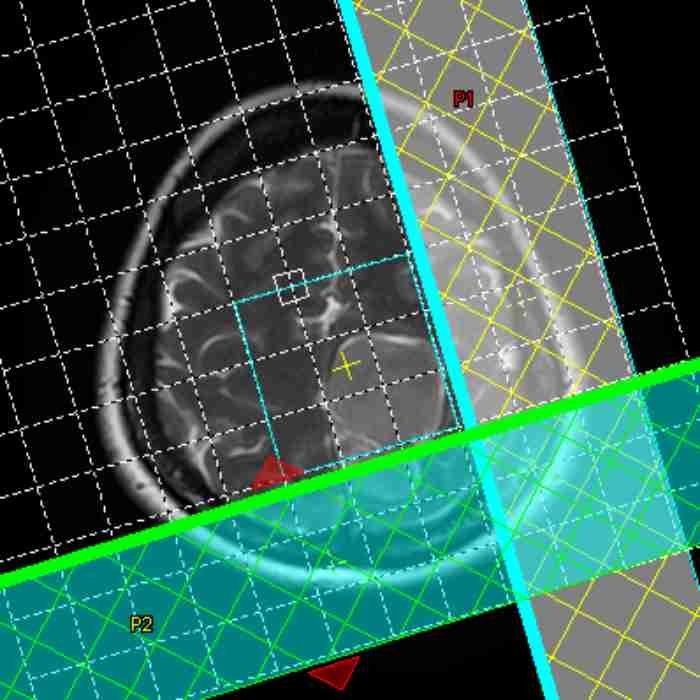
Magnetic Resonance Spectroscopy, which is commonly known as MRS among professionals, is one of the amazing inventions developed by humankind because MRS can analyze pathologies by its molecular composition. For this reason, citing an article that thoroughly explains the correct application of MRS will help users improve their skills and patients receive an accurate diagnosis.
Indications
- Suspicion of primary or secondary neoplasm
- Grade high-grade versus low-grade glioma
- Differentiate abscess versus cystic neoplasm
- Evidence of brain infection
- Evidence of seizures
- Suspicion of diseases such as Alzheimer’s and Parkinson’s, Huntington’s and amyotrophic lateral sclerosis
- Suspicion of subclinical or clinicalmetabolic encephalopathy
- Suspicion of metabolic disorders such as leukodystrophies and mitochondrial encephalopathies
- Suspicion of acute infarction
- Suspicion of demyelination
- Suspicion of spinal cord disorders
Spectrum of MR Spectroscopy
MRS displays a spectrum that represents different metabolites and their quantities in tissue. The X-axis of the graph represents the chemical shift of metabolites, and the Y-axis denotes the signal intensity of each metabolite, which is directly proportional to the metabolite quantity.
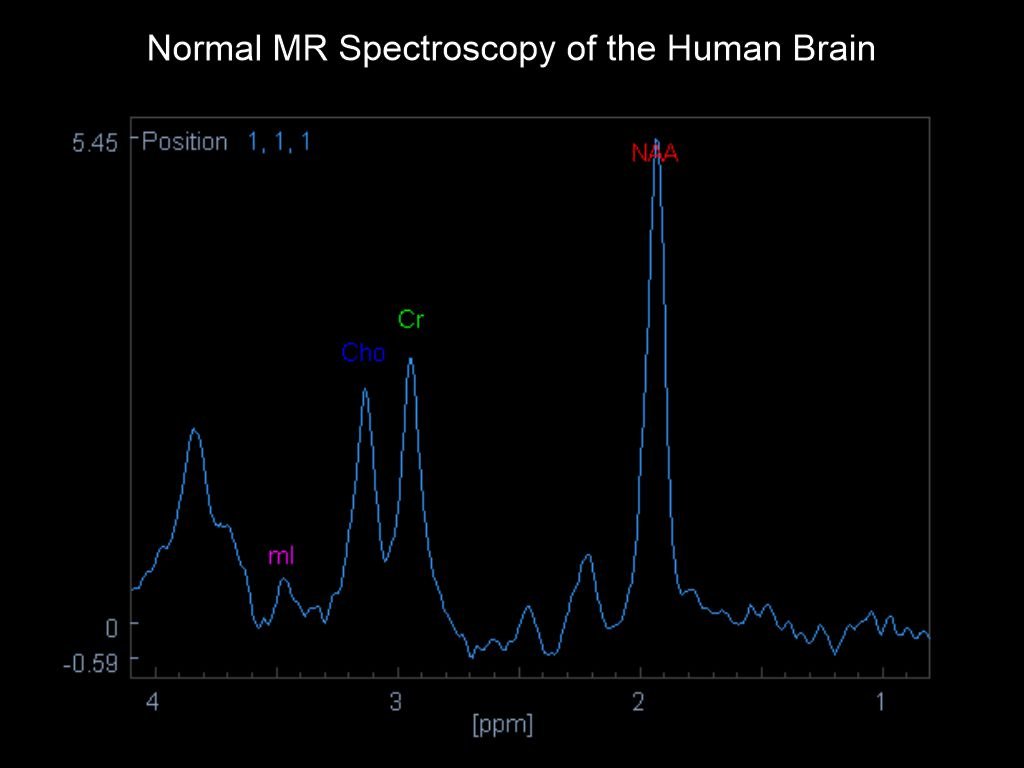
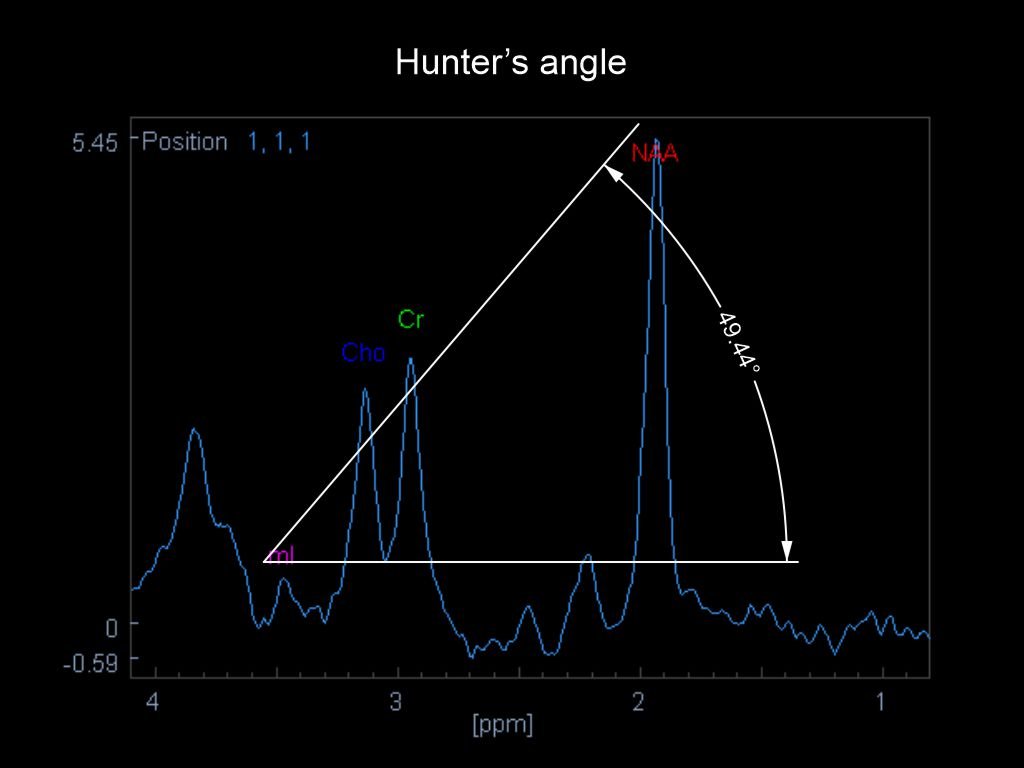
There is a technique to judge whether a patient’s MRS spectrum is normal. It is called Hunter’s angle. A line at nearly 45-degrees is formed when myo-inositol (mI), choline (Cho), creatine (Cr), and N-acetylaspartate (NAA) peaks are joined.
The major metabolites seen in MR Spectroscopy are shown below, along with their position on the x-axis of the spectrum:
- Lipids (Lip): resonates at 1.3 ppm
- Lactate (Lac): resonates at 1.33 ppm
- Alanine: resonates at 1.48 ppm
- N-acetylaspartate (NAA): resonates at 2.0 ppm
- Glutamine (Gln) (Glx)/glutamate (Glu): resonates at 2.2-2.4 ppm
- GABA: resonates at 2.2-2.4 ppm
- 2-hydroxyglutarate: resonates at 2.25 ppm
- Citrate (Cit): resonates 2.6 ppm
- Creatine (Cr)/ Phosphocreatine: resonates at 3.0 ppm
- Choline (Cho): resonates at 3.2 ppm
- Myo-inositol (mI): resonates at 3.5 ppm and 4.06 ppm
- Water: resonates at 4.7 ppm
Steps in an MR Spectroscopy scan
In this section, the major practical steps in an MR spectroscopy scan are summarized, but the third step, global shimming, may or may not be included, depending on the manufacturer.
I. The anatomical region to be scanned is positioned at the iso-center of the MRI scanner.
Explanation: MRS is highly sensitive to magnetic field inhomogeneity, and the scanner iso-center has the most homogenous static magnetic field.
II. Locator images are acquired for MRS planning.
Explanation: Locator images may be needed to capture the pathology in a plane that excludes air-filled cavities, water-filled areas, and fat-containing areas, and this is recommended for multivoxel MRS planning. Refer to the MR Spectroscopy planning section for more details.
III. Global shimming is performed for the entire region of interest (ROI).
IV. Local shimming is performed for the MRS voxels, achieving a high-accuracy shimming.
Explanation: A high resolution of 64x64 matrix, which is finer than that used in routine shimming, is set for local shimming. This step is important to maximize the data quantity within the voxels, and target voxels are included at the center of the local shimming slab.
V. MRS target voxels are planned, and care is taken to avoid air-, fat- and water-filled areas.
VI. Post-processing is performed to get the best spectrum.
Parameters and Technical considerations in MR spectroscopy
There is a strong relationship between the results of the MRS spectrum and the scan parameters. Therefore, the user should understand the basics, and this knowledge helps them recognize and correct artifacts in MRS spectra. The user should understand TE, single-voxel, multiple-voxels, shimming, voxel size, signal-to-noise ratio (SNR), number of excitations (NEX) and field strength (1.5 T or 3 T).
Echo time (TE)
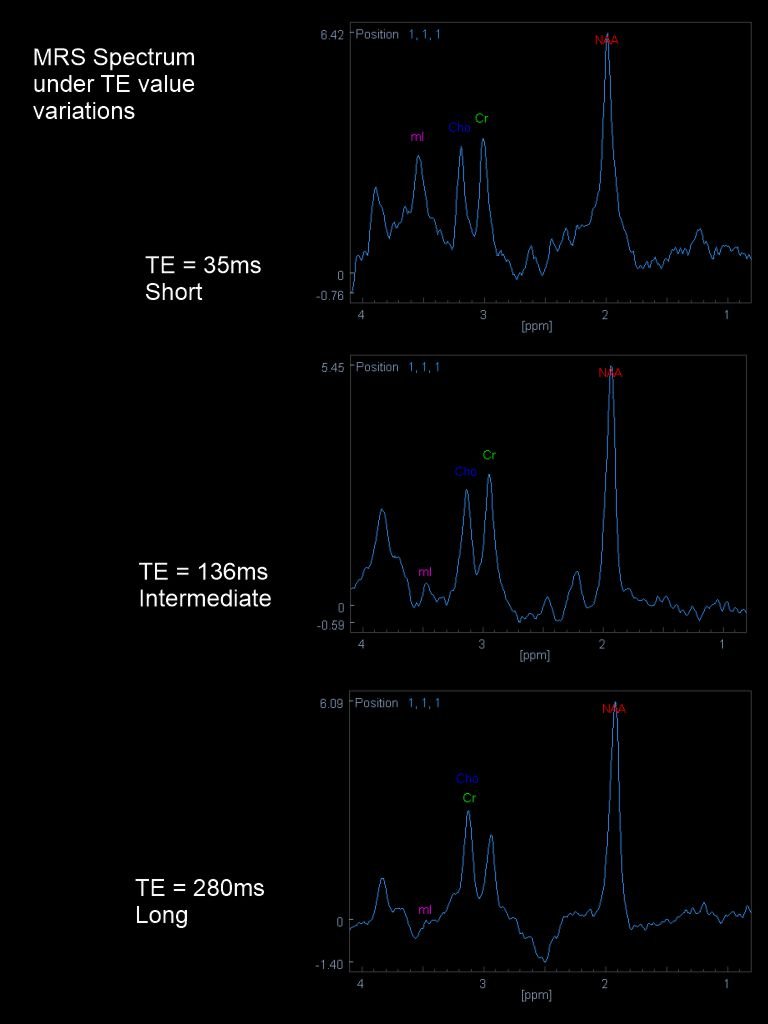
The TE selection depends on the clinical indication of the patient. A Short TE, with values from 20 to 40 ms, is useful for analyzing myo-inositol (mI), glutamine or glutamate (Glx), amino acids, lactate, and metabolic and neurodegenerative disorders (Alzheimer’s disease), seizures, and disorders of myelination.
An Intermediate TE, with values from 97 to 144 ms, is applied to differentiate lactate and alanine from lipids. The Intermediate TE provides a better-defined baseline and less baseline distortion than a short TE, and it shows no abnormal N-acetylaspartate (NAA). Lipids in the ROI are shown more significantly when scanned under intermediate TE than short TE. Cho and NAA peaks are more reproducible and accurate at intermediate TE. For the recognition of IDH1-mutant glioma, intermediate TE provides optimal identification of 2HG scanned at 3 T.
A Long TE, with values from 270 to 288ms, provides weaker signal from NAA, Cho, and Cr relative to the baseline noise. Therefore, long TE may be used to acquire data for comparison with short- and intermediate-TE data. In addition, MRS with long TE may be performed on 3 T scanners for more fine depiction of lactate levels.
Multivoxel and single-voxel MRS
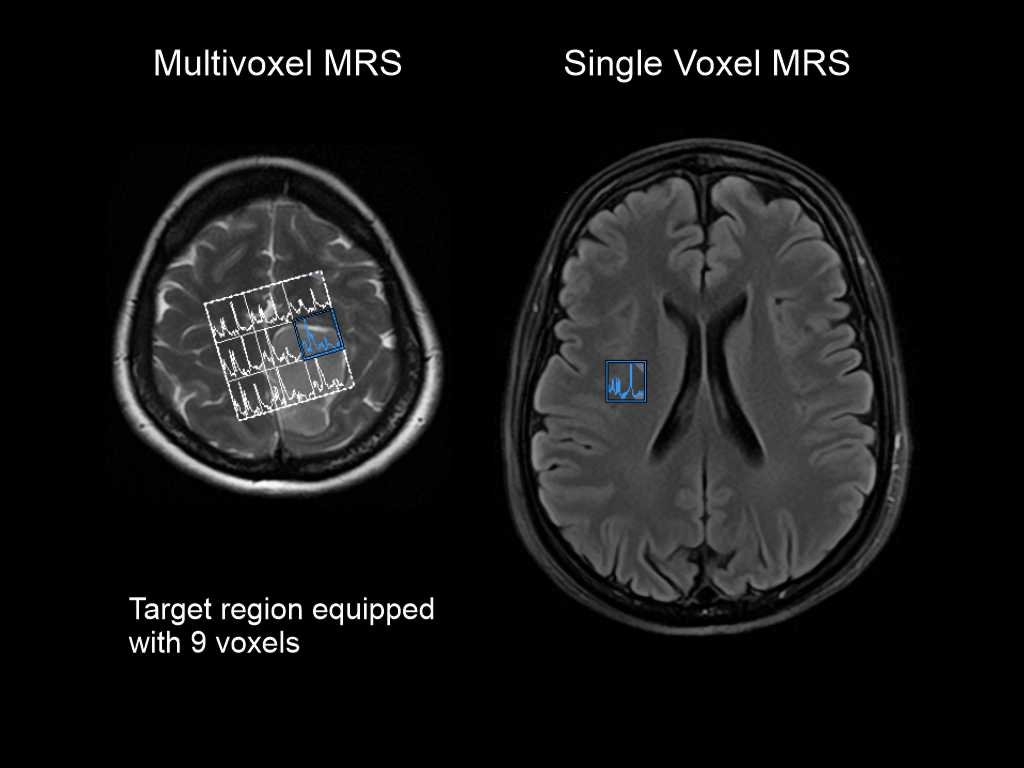
Either multivoxel or single-voxel MR spectroscopy is chosen, depending on the nature of the pathology. Multivoxel MRS acquires multiple adjacent voxels over a large ROI, whereas single-voxel MRS acquires a single voxel. Multivoxel MRS is recommended for a lesion with well-defined margins (focal) because the technique provides data from within the lesion as well as from the surrounding normal tissue for comparison. Single-voxel MR spectroscopy is recommended for a lesion that is widely spread throughout the organ (diffuse) because MRS changes should be analyzed diffusely.
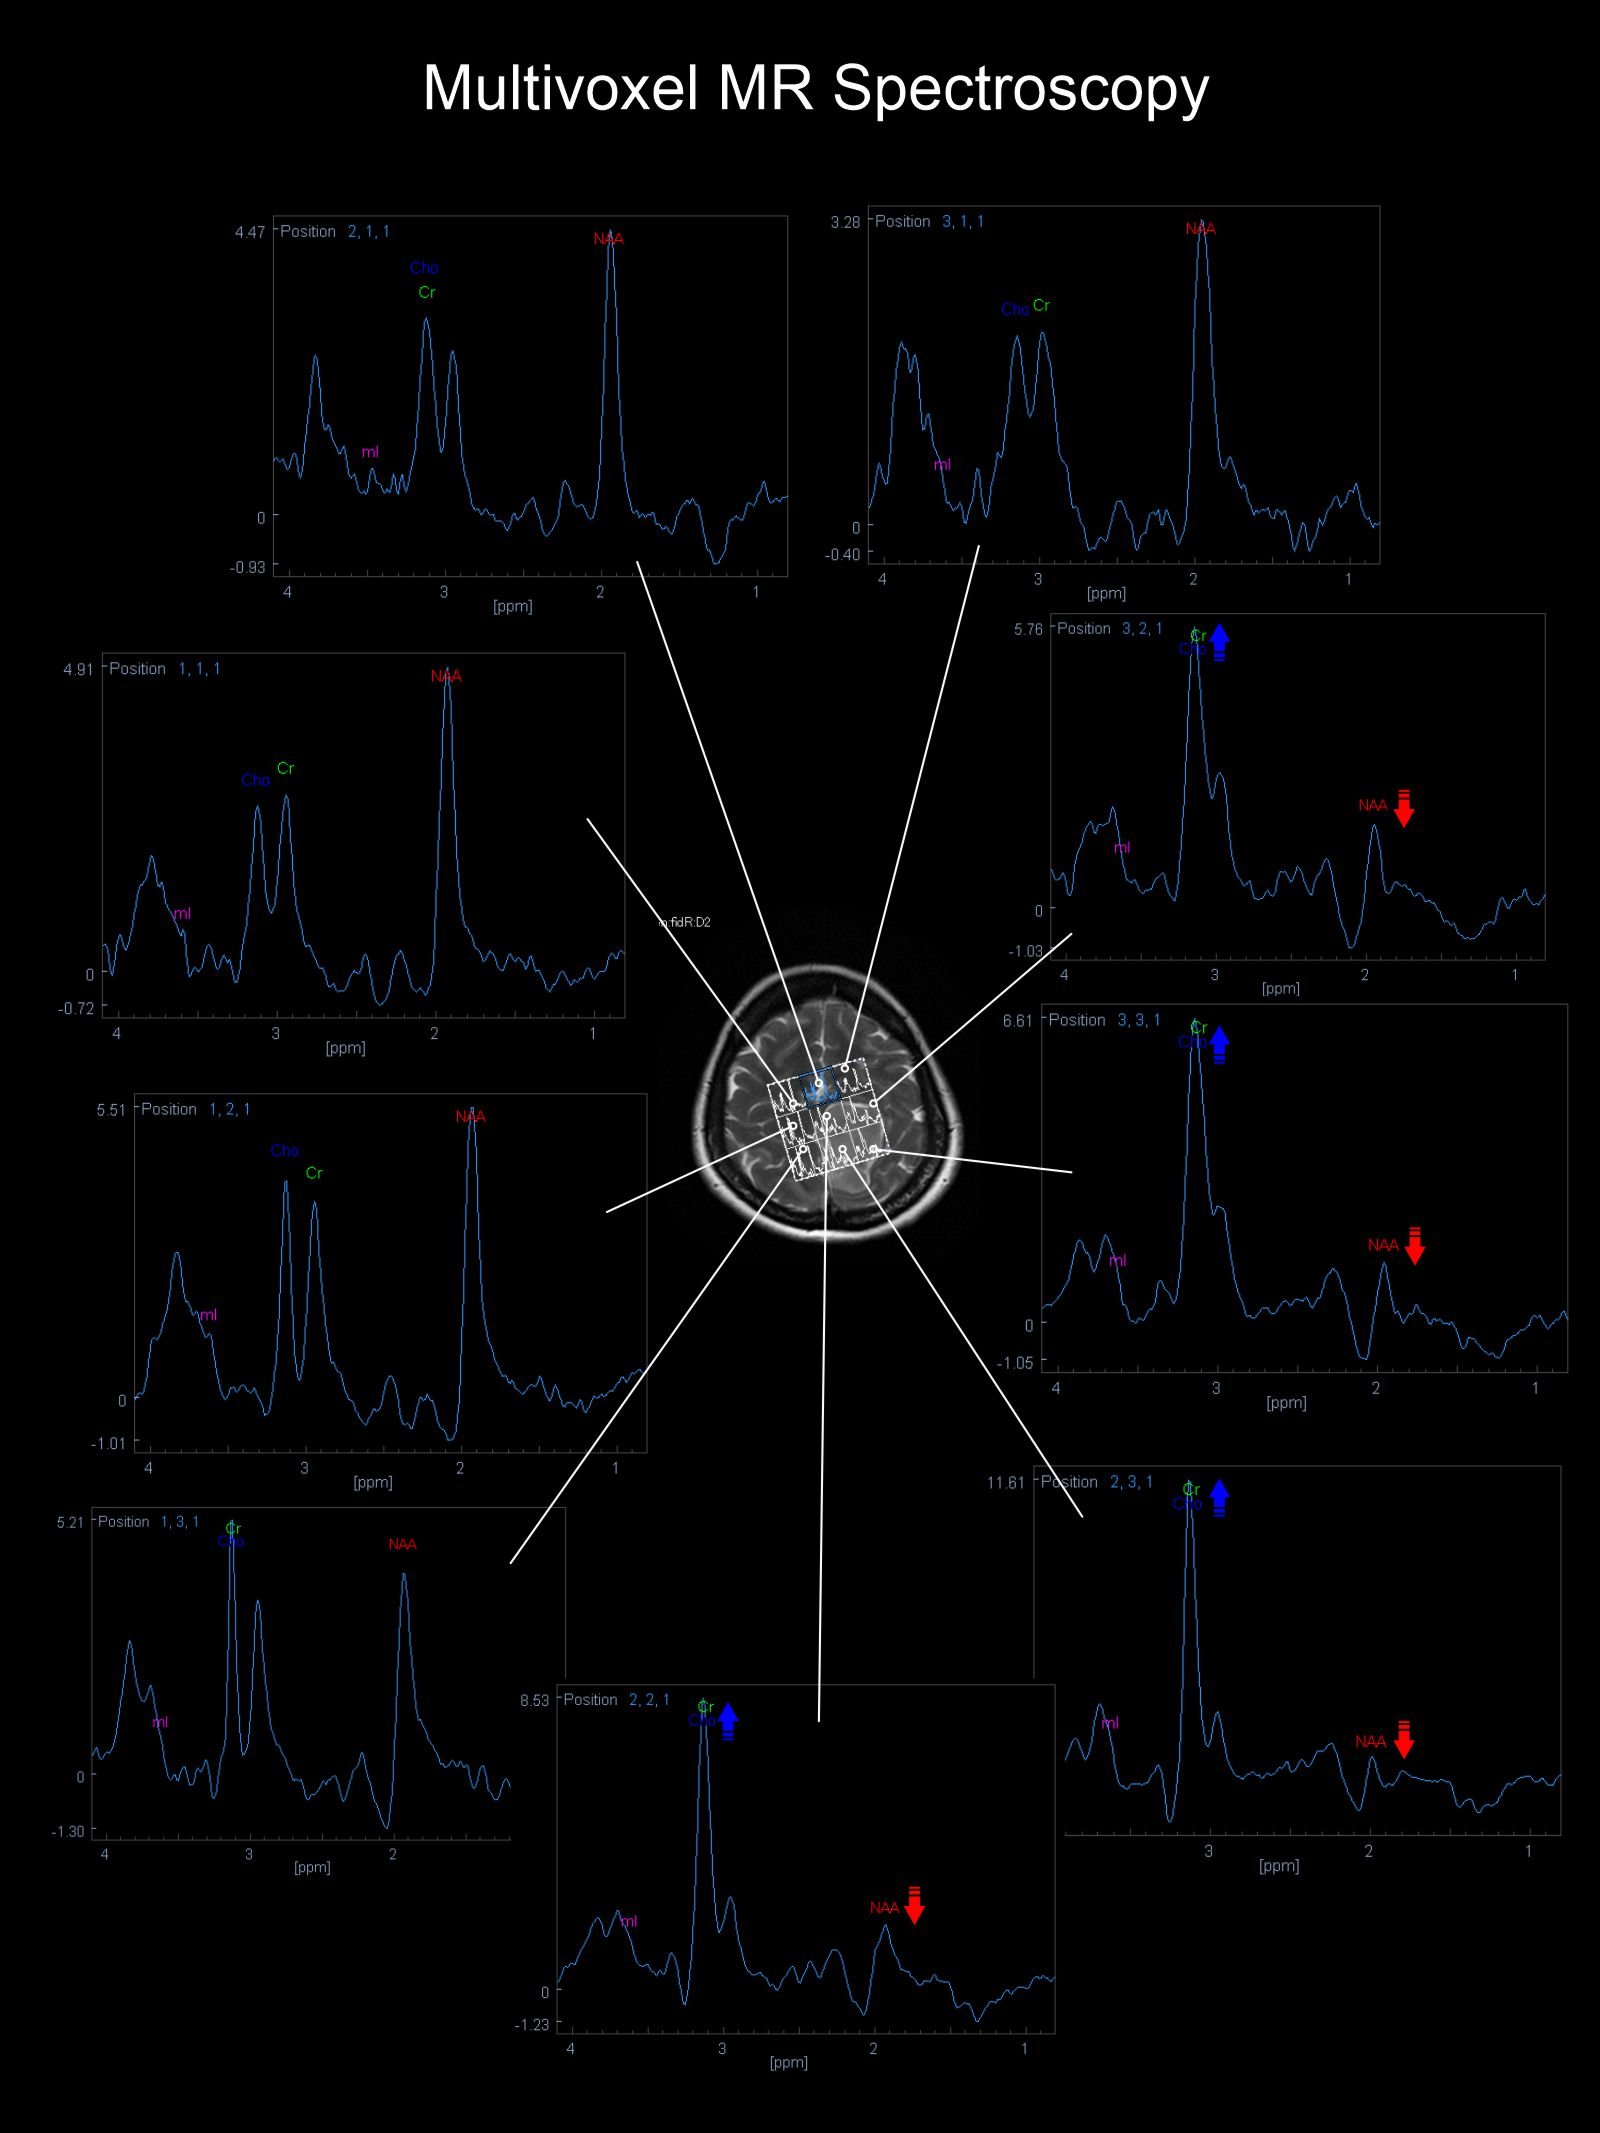
Multivoxel MR spectroscopy of a patient with a brain lesion is shown below. The Spectra of the voxels outside the lesion show normal metabolite peaks (Hunter’s angle), whereas those of the voxels inside the lesion show lower NAA levels and a higher Cho:Cr ratio.
Signal to Noise Ratio (SNR)
Voxel size is directly proportional to the SNR. The preferred voxel size for MRS is 2 x 2 x 2 cm or 8 ml. Nevertheless, a smaller voxel size may be needed to avoid partial volume effects that can be avoided by reducing the voxel size to as small as 1.6 x 1.6 x 1.6 cm or 4 ml. It is important to note that each reduction in voxel size lowers the SNR, and NEX should be increased to improve SNR at the expense of a longer scan time.
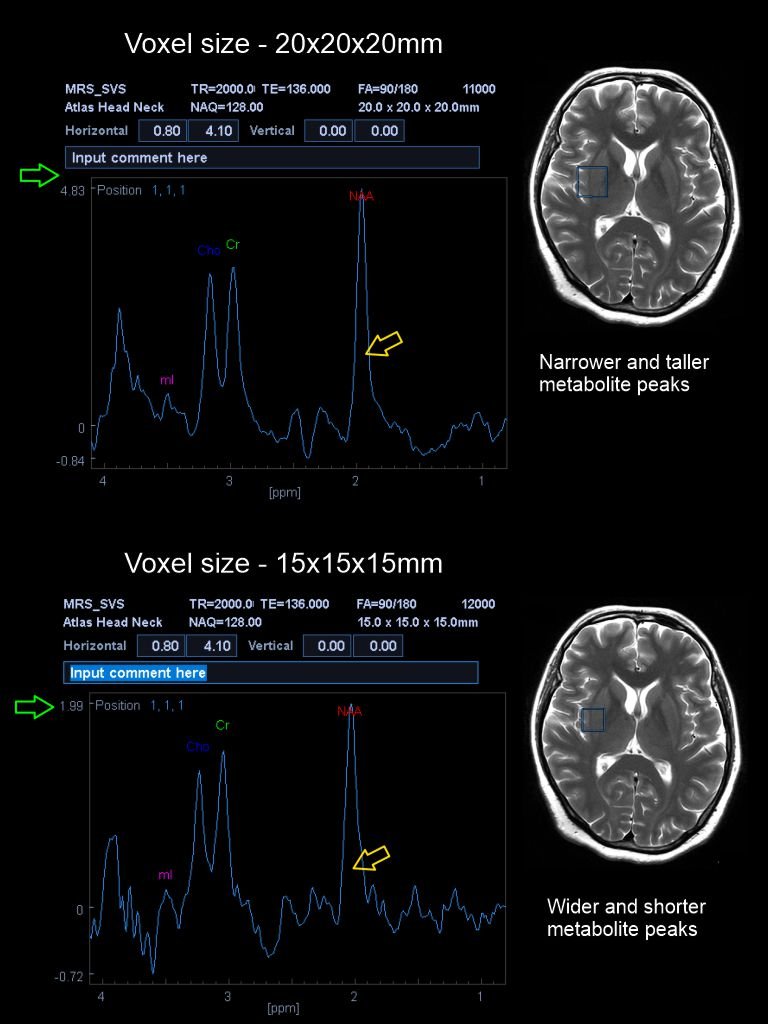
Explanation: Theoretically, when voxel volume is reduced by half, NEX must be increased by a factor of 4, but this theory may not be practical to spend over 20 minutes to complete a MRS. Therefore, following combinations may be used in actual scanning for single-voxel acquisitions with an intermediate TE (136ms) and TR=2s.
- Voxel size of 2x2x2 cm is scanned with 128 NEX or NAQ which can be completed nearly within 4 minutes.
- Voxel size of 1.5x.1.5x1.5 cm is scanned with 256 NAQ which can be completed nearly within 8minutes.
- Voxel size of 1.2x1.2x1.2 cm is scanned with 512 NAQ which can be completed nearly within 17minutes.
For short TE (25ms), set the NAQ half of the above-mentioned values. Use the same NAQ values for long TE.
For multivoxel acquisitions with TE=136ms and TR=1500ms, matrix size is changed with the voxel size, but keeping the NAQ=1.
- Voxel size of 1.5x1.5x2 cm is set for a matrix size of 16x16x1 which can be completed nearly within 4 minutes.
- Voxel size of 1.5x1.5x1.5 cm is set for a matrix size of 16x16x1 which has the same time duration of 4 minutes.
- Voxel size of 1.1x1.1x1.0 cm is set for a matrix size of 12x12x8 which can be completed within nearly 18 minutes.
Set the NAQ to 2 if the SNR of the spectrum is not satisfactory.
Shimming
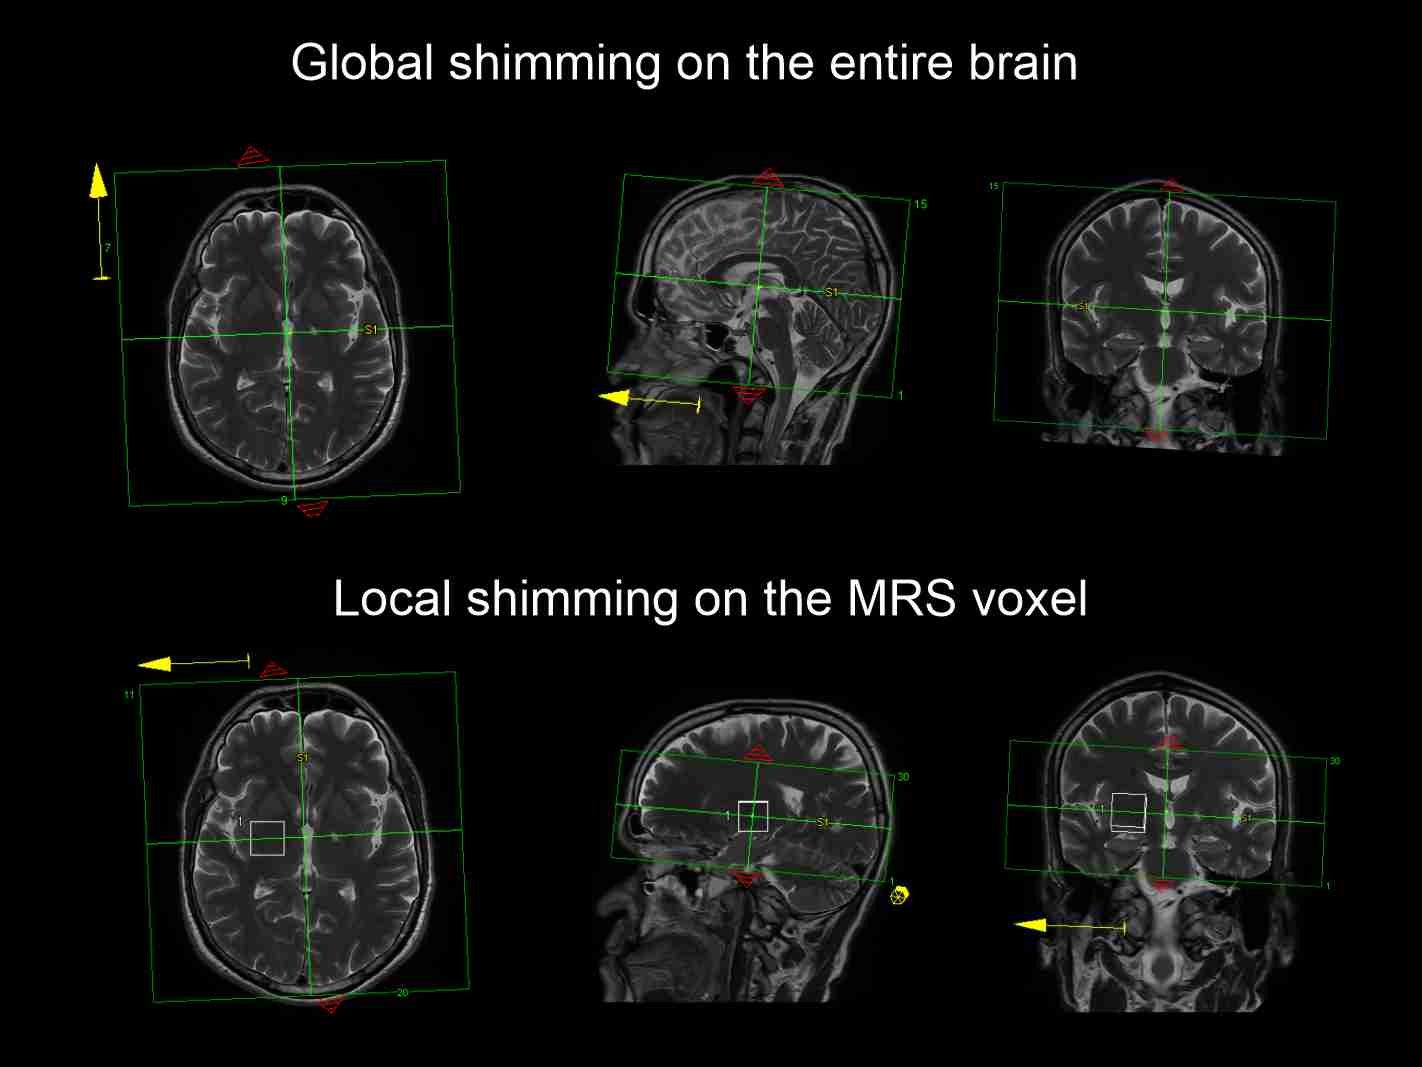
Adequate shimming before MRS acquisition provides a better spectrum, resulting in narrower peak widths, a higher SNR, and improved water suppression. Usually, shimming is done in two steps. First, shimming is performed to the whole brain, and second, local shimming is applied over the voxels. The single-voxel spectra are easier to shim than multivoxel spectra, and finer shimming is needed for voxels placed at the periphery of the brain than for those at the center.
Planning in MR spectroscopy
The main components used in MRS planning are saturation bands, voxels, target region, and grid. The voxel is the smallest unit used to acquire signals. Multivoxel MRS has a grid and a target region; the target region is composed of all active voxels and lies inside the grid.
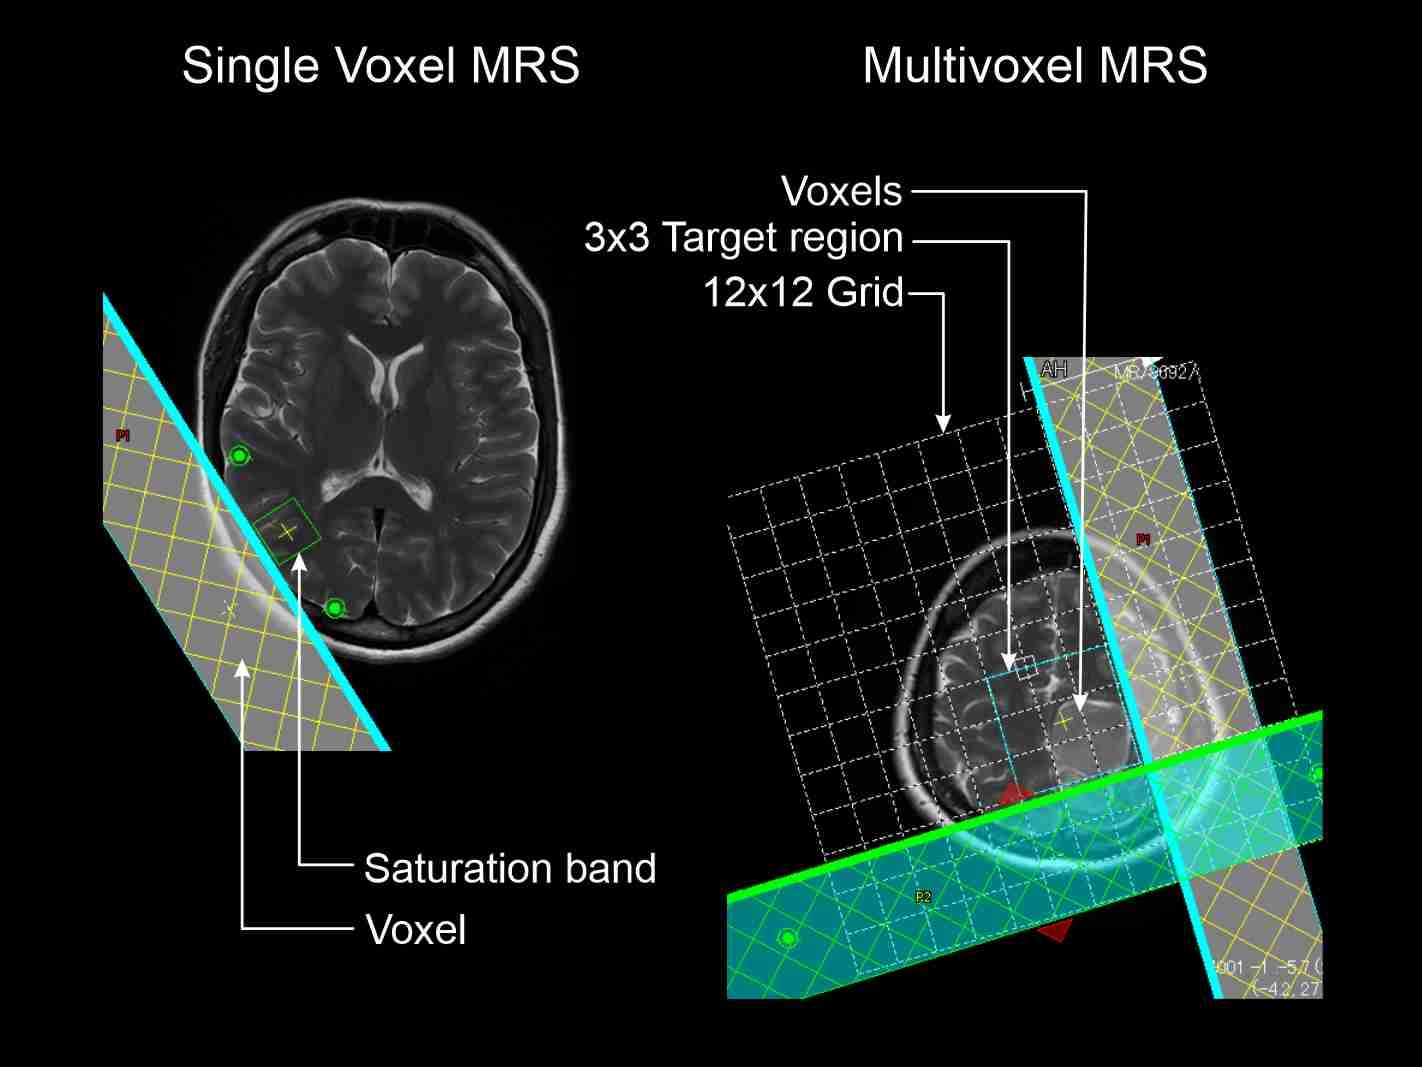
Accurate identification of the target region is one of the key steps in MRS. The target region can be identified by reviewing at the patient’s medical history, surgical records, previous radiological imaging and by following the radiologist’s guidance. The Lesion should be placed inside the voxel, and the user needs to identify the dimensions of the lesion accurately. Usually, MRS is performed after intravenous (IV) contrast administration because contrast enhances the lesion, making its margins easier to see. However, MRS must be performed prior to contrast administration if the purpose of the scan is to evaluate D-2 hydroxyglutate (2HG).
MRS-problematic areas
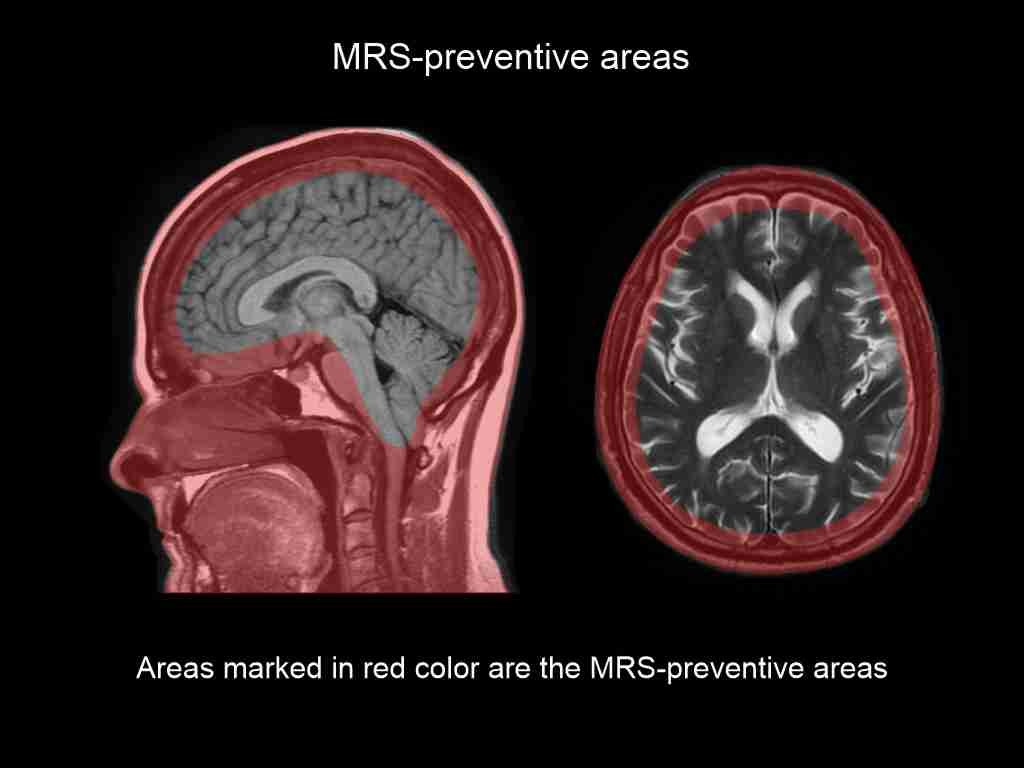
Regions containing lots of water (e.g., CSF-filled ventricles, urine-filled bladder), air-filled cavities (e.g., auditory canal, sinuses, nasal cavity, intestines), hemorrhage, large regions and the bony calvarium (fat) can be considered as MRS-problematic areas because these areas can affect water suppression, causing susceptibility or poor shimming. Not only the mentioned regions but also the area around them can degrade spectral quality, so they should be avoided if possible. Magnetic field homogeneity is poor around air-filled cavities. Therefore, if the pathology is near MRS-problematic areas, try to avoid them by rotating the target voxel or by positioning the target voxel away from those areas as far as possible. For example, during prostate MRS, the target voxels need to be positioned away from the rectum.
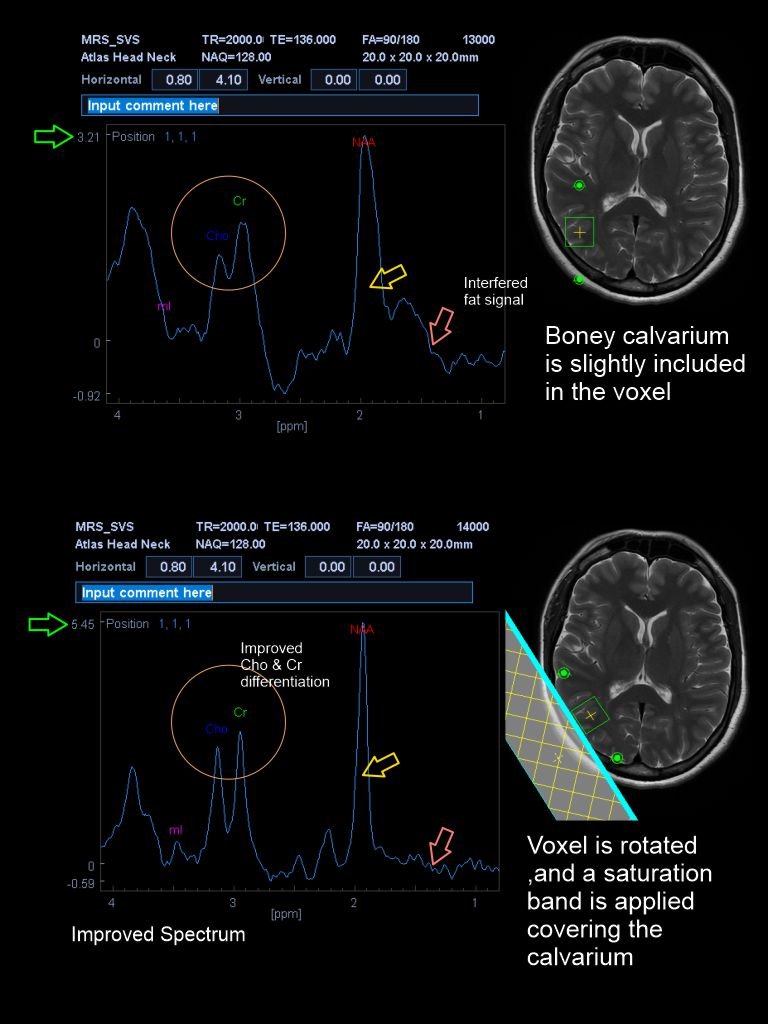
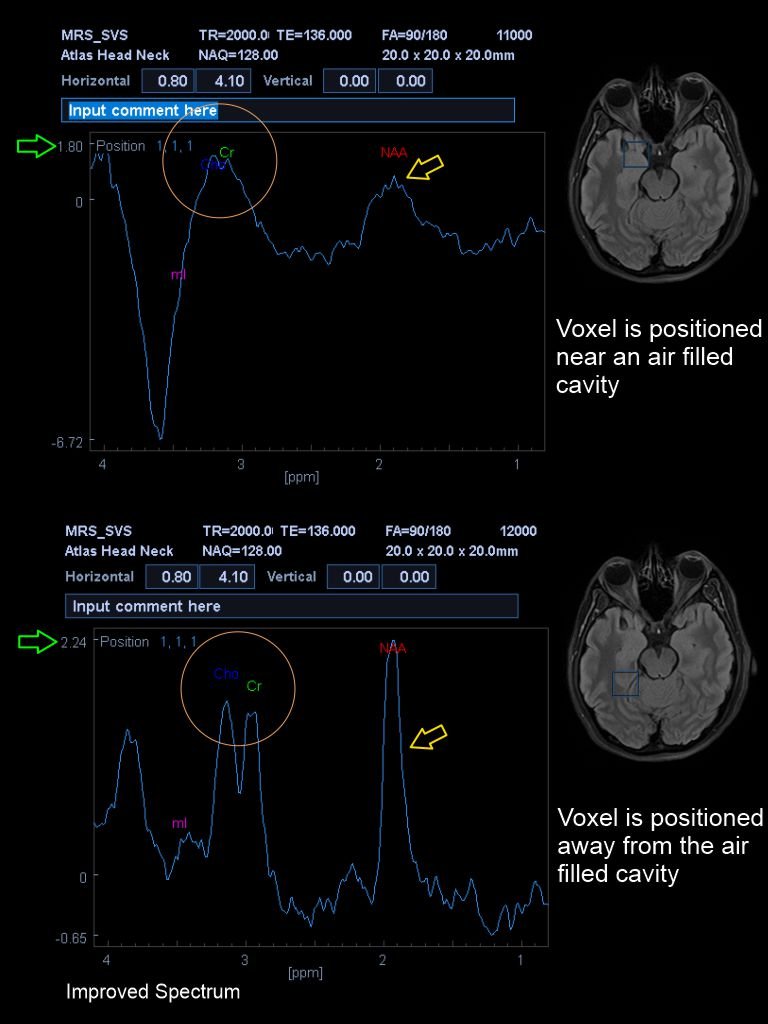
Water suppression is an important requirement in MRS for detecting metabolite peaks because metabolites are present in tiny amounts alongside water, the most abundant substance in tissue. However, water saturation is less effective if the water-filled areas are included in the voxel. Using a saturation band over an MRS-problematic area that is close to the voxel can improve results, so use less than four saturation bands with pre-saturation flip angles of 950, 1000, 1050 and 1100.
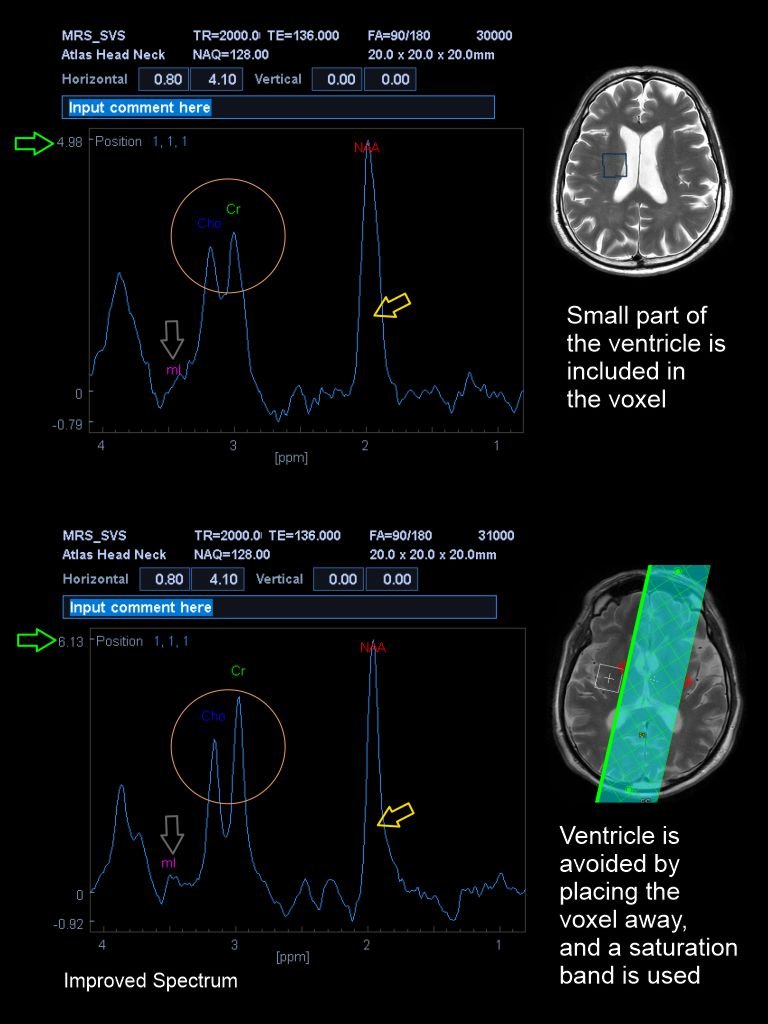
In multivoxel MRS, an oblique axial locator image can be acquired to avoid the MRS-problematic areas. In addition, saturation bands can be used over such regions to minimize external signals.
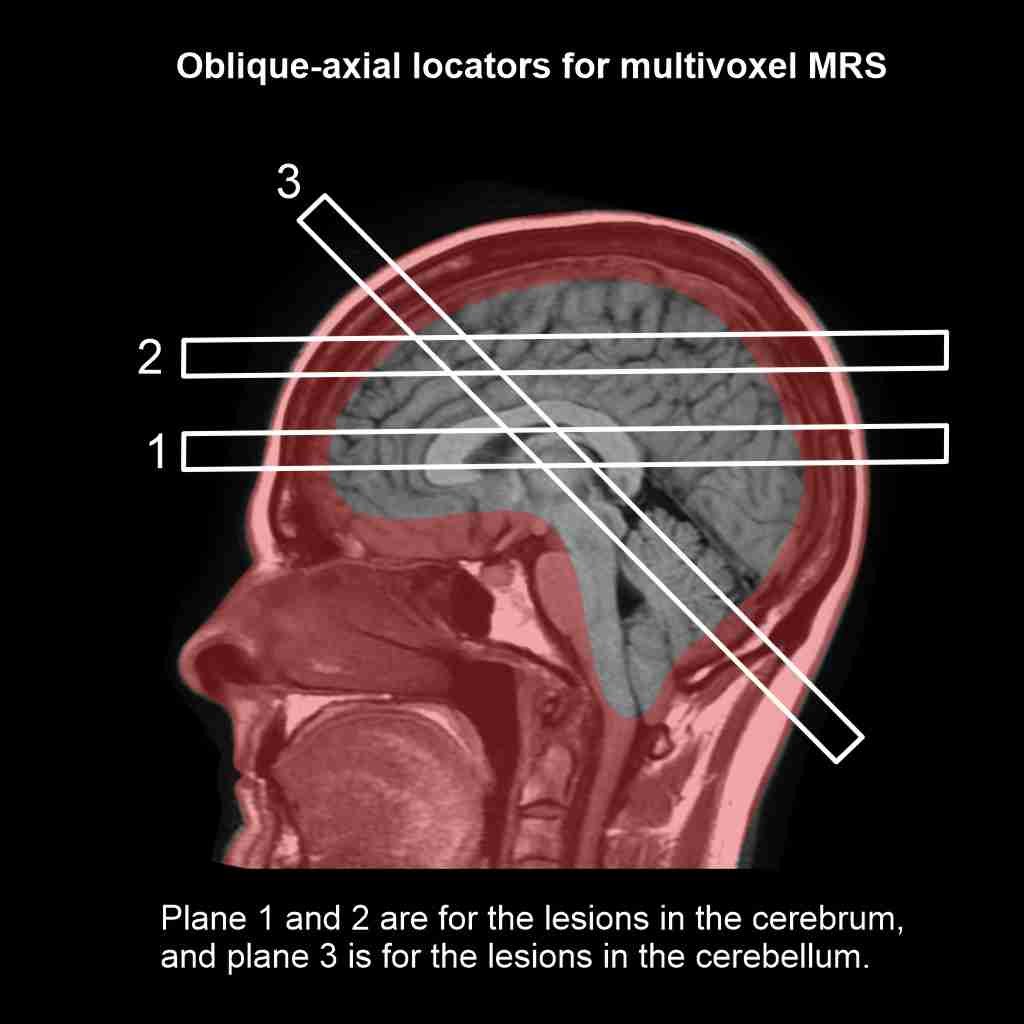
In large lesions and hemorrhages
Large lesions and hemorrhages make the static magnetic field inhomogeneous. This effect can be minimized by reducing the voxel size; however, remember to increase the NEX, as mentioned above, which improves the SNR. In addition, target area of multivoxel MRS can be reduced to grid sizes such as 2 x 3 or 2 x 2.
MRS spectrum quality reducing factors
The final MRS spectrum should be evaluated for artifacts that may arise from poor shimming, incomplete water suppression , lipid contamination, voxel bleeding, and chemical shift.
Poor shimming and incomplete water suppression
If a spectrum has metabolite peaks that are short, broad and poorly defined, poor shimming may be the course. Insufficient shimming may reduce frequency resolution and broaden the peaks, and incomplete water suppression may leave residual water signals in the peak areas of the metabolite, causing baseline fluctuations.
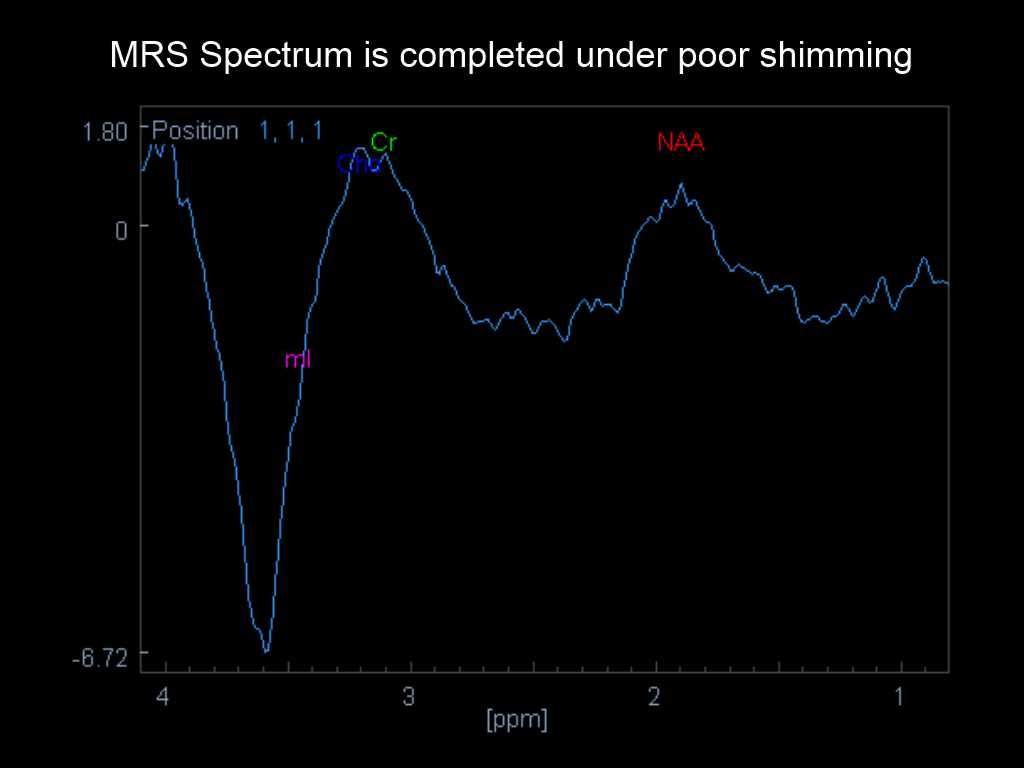
When metabolite peaks are broadened, the water signal overlaps with metabolite peaks close to chemical shift of water, and the fat signal overlaps with metabolite peaks close to chemical shift of fat, and external signals overlap with signals from the target region.
Lipid contamination
Lipid contamination is mainly caused by the inclusion of fatty tissue such as bone in the MRS voxel. An increased signal can be seen around lipid chemical shift of 1.3 ppm, and the lipid signal overlaps with chemical shifts close to those of lipids, such as NAA (2.0 ppm).
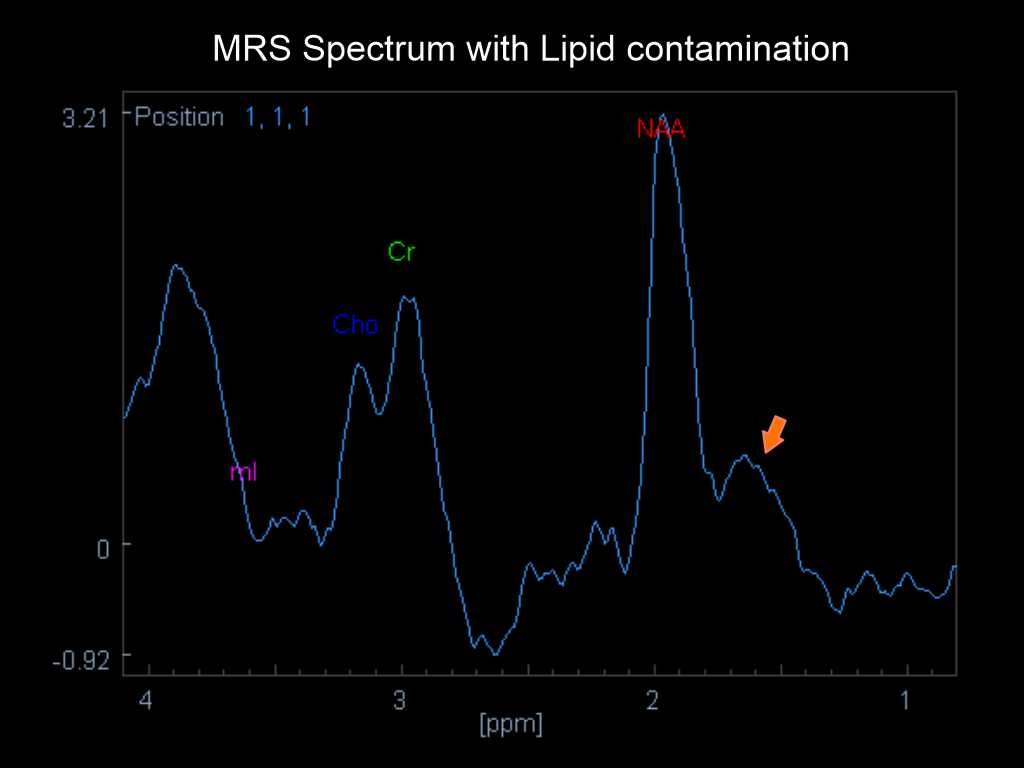
Chemical shift artifact
The chemical misregistration artifact is common in MR spectroscopy and occurs because of spatial misregistration of fat and water molecule frequencies.
Voxel bleeding
Voxel bleeding occurs in multivoxel MRS when the signal from one voxel bleeds into the adjacent voxels.
MRS on 1.5T versus 3T MRI Scanners
Both adult and pediatric MRS can be performed on both 1.5T and 3T scanners. However, higher SNR in the 3T scanner is an advantage compared to 1.5T, as 3T scanners provide narrower and higher metabolite peaks and have the potential to reduce voxel size minimally compromising the spectrum. In addition, 3T scanners require shorter acquisition time for MRS.
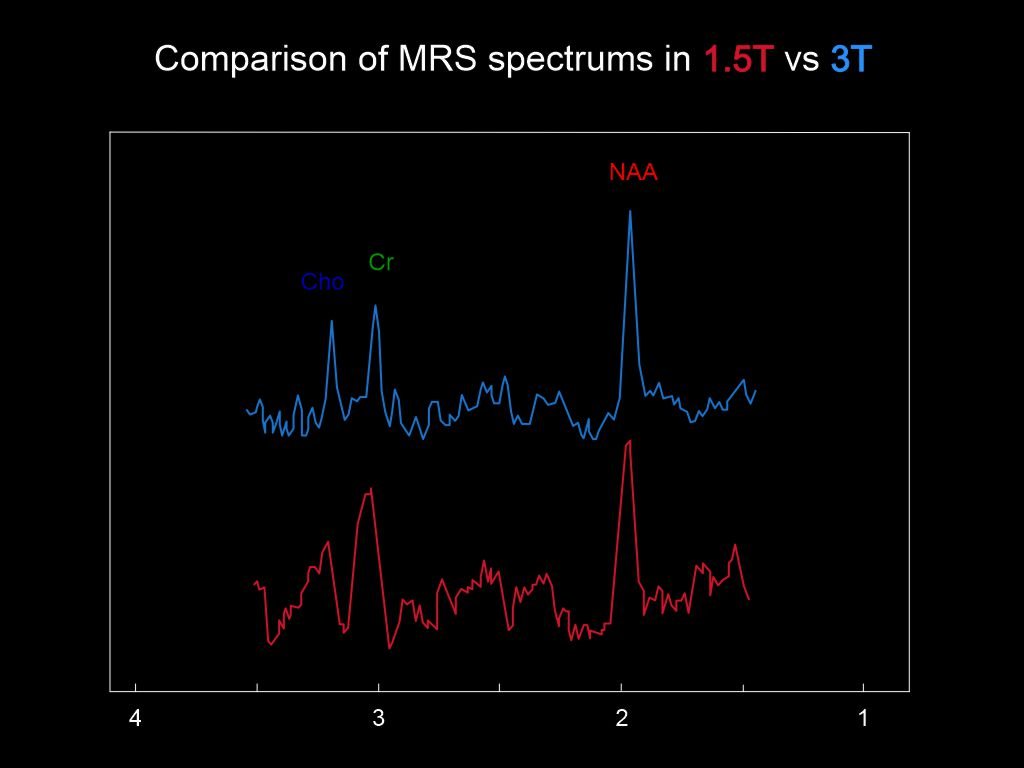
When comparing MRS spectra of 1.5T and 3T scanners, the 3T spectrum shows improved Cr-to-Cho resolution, a better SNR, and a flatter baseline between 2 and 3 ppm.
MRS spectrum in Typical Pathologies
The behavior of the MRS spectrum can be unique to the pathology, but accurate diagnosis cannot be made relying solely on MR spectroscopy. Some of the typical pathologies and their MR spectroscopy spectra are listed below, and you can use the list to identify lesions whenever you complete a patient’s MRS scan.
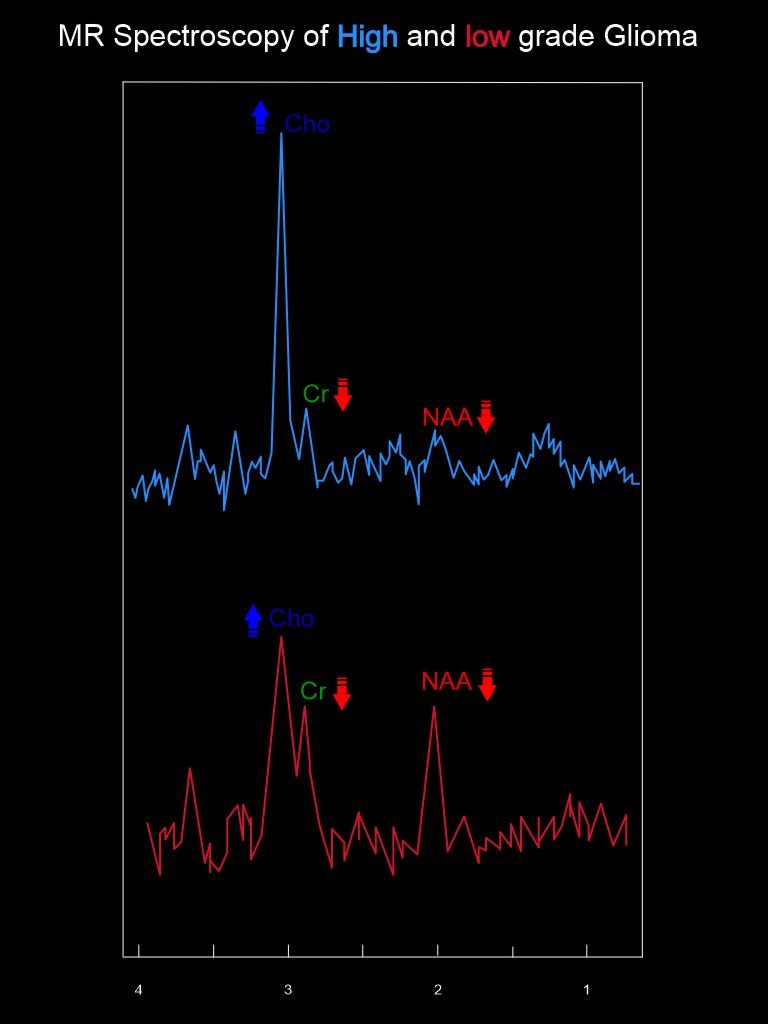
I. Glioma
- As the Glioma grade increases;
- N-acetylaspartate (NAA) and Creatine (Cr) – Decrease
- Choline (Cho), Lipids (Lip) and Lactate (Lac) – Increase
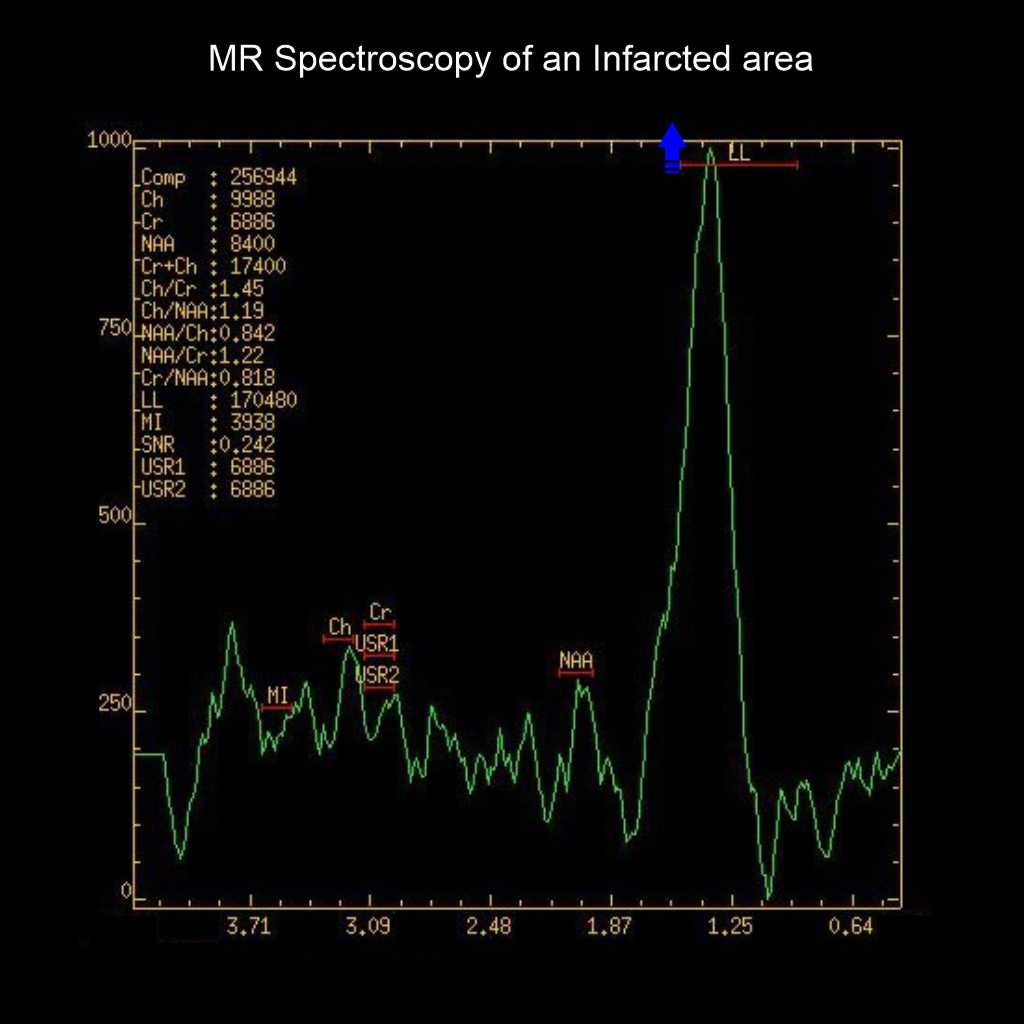
II. Infarction
- Lipids (Lip) and Lactate (Lac) – Increase
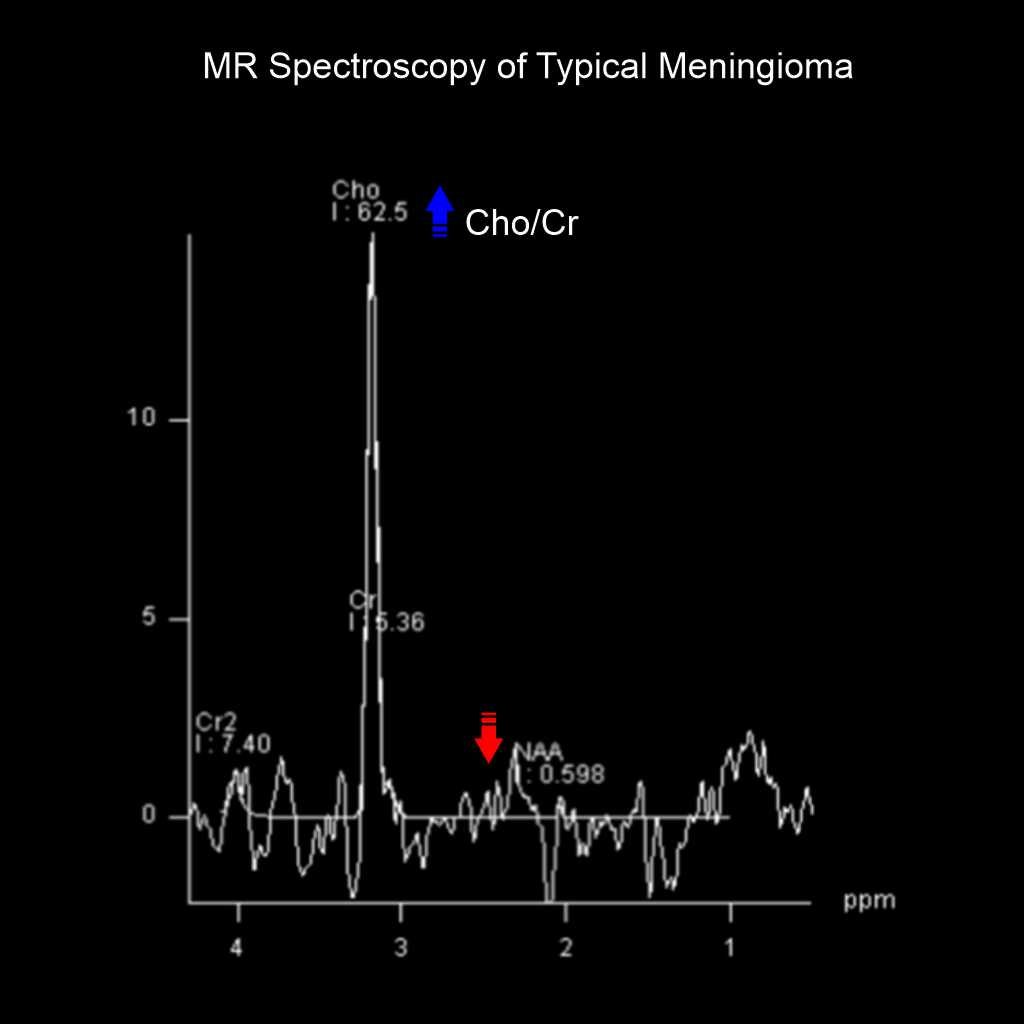
III. Typical Meningioma
- Cho/Cr ratio – Increase
- N-acetylaspartate (NAA) – Decrease
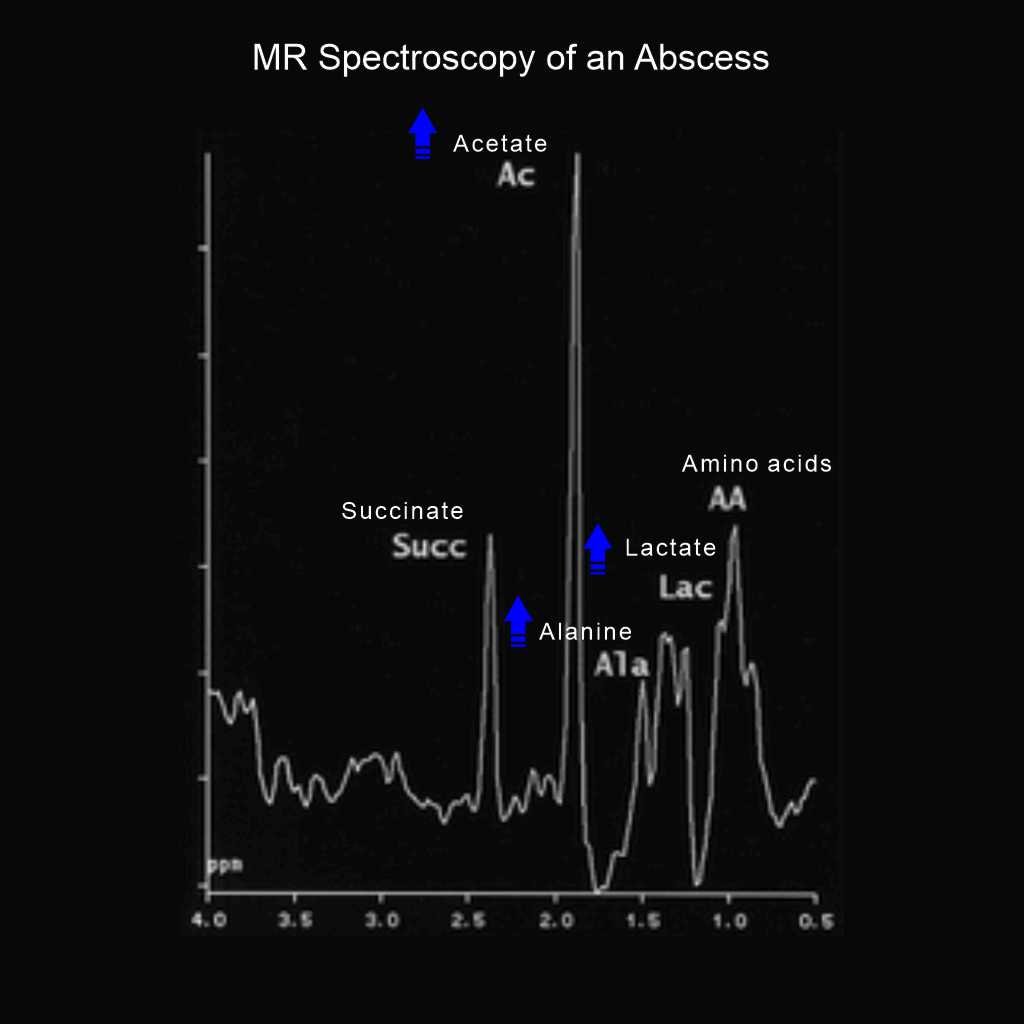
IV. Infection or Abscess
- N-acetylaspartate (NAA) – Absent
- In bacterial abscess;
- Lactate (Lac), Alanine (Ala), Cytosolic acid and Acetate (Ace/Ac) – Increase or Present
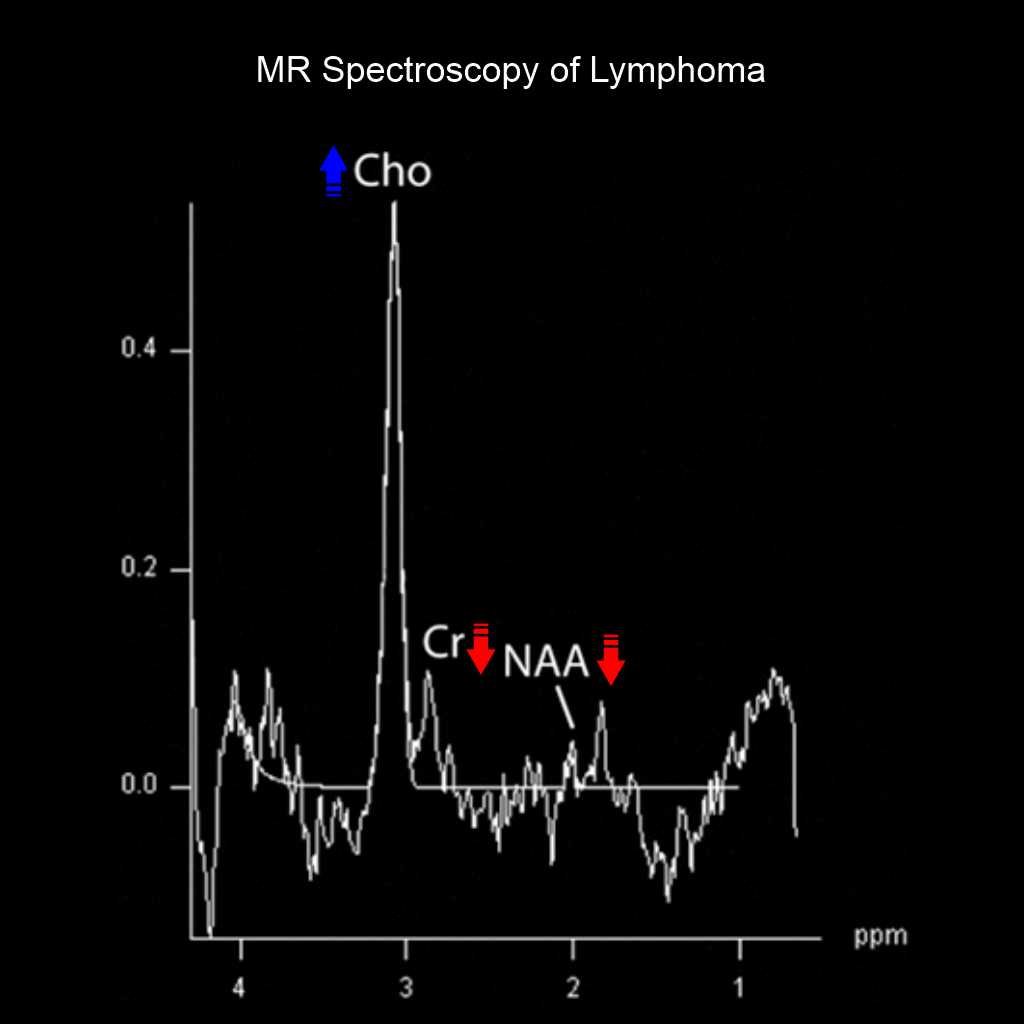
V. Lymphoma
- Choline (Cho) – Increase
- Creatine (Cr), N-acetylaspartate (NAA) – Decrease
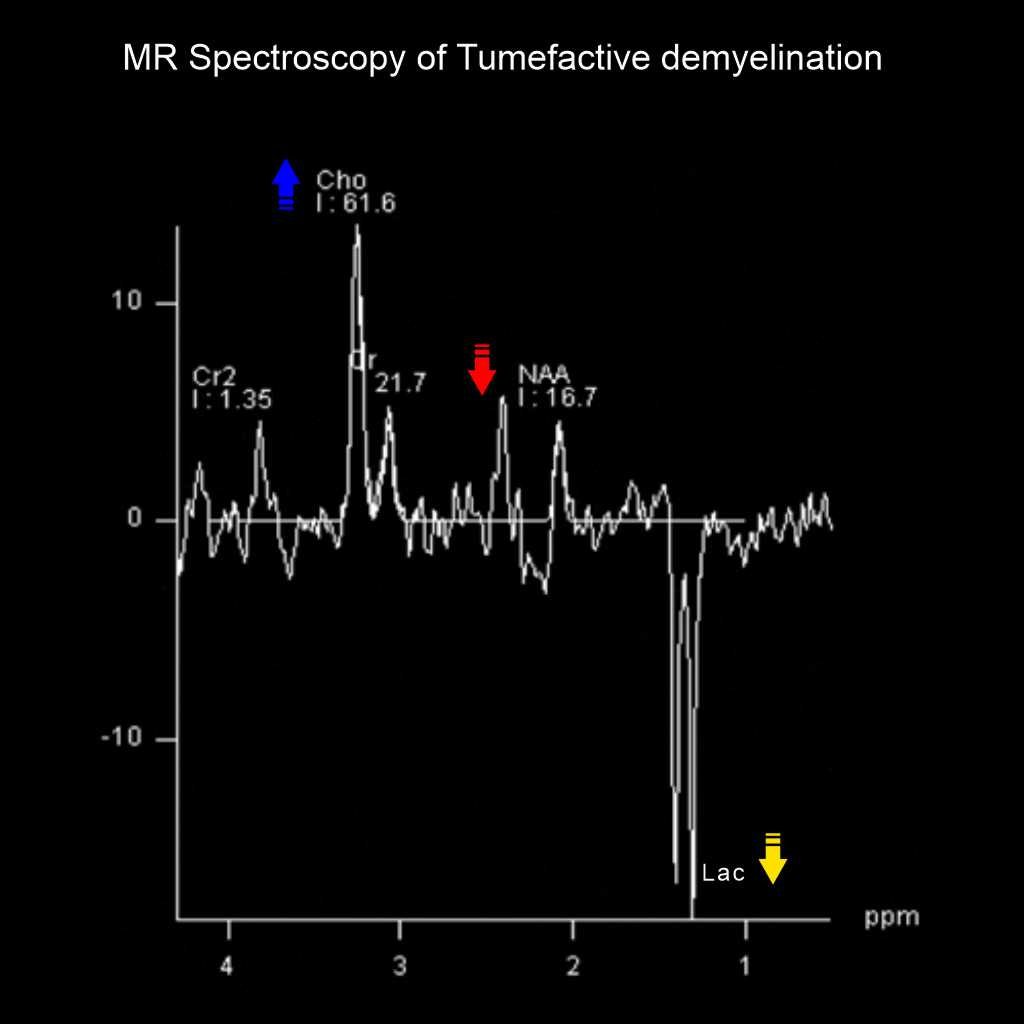
VI. Tumefactive demyelination
- Choline (Cho) – Increase
- N-acetylaspartate (NAA) – Decrease or near complete loss
- Lactate (Lac) – Inverted double Lac peaks
Reference
- Tognarelli JM, Dawood M, Shariff MI, Grover VP, Crossey MM, Cox IJ, Taylor-Robinson SD, McPhail MJ. Magnetic Resonance Spectroscopy: Principles and Techniques: Lessons for Clinicians. J Clin Exp Hepatol. 2015 Dec;5(4):320-8. doi: 10.1016/j.jceh.2015.10.006. Epub 2015 Nov 12. PMID: 26900274; PMCID: PMC4723643.
- Sitter B, Sjøbakk TE, Larsson HBW, Kvistad KA. Clinical MR spectroscopy of the brain. Tidsskr Nor Laegeforen. 2019 Mar 25;139(6). Norwegian, English. doi: 10.4045/tidsskr.17.1099. PMID: 30917645.
- Nagashima H, Tanaka K, Sasayama T, Irino Y, Sato N, Takeuchi Y, Kyotani K, Mukasa A, Mizukawa K, Sakata J, Yamamoto Y, Hosoda K, Itoh T, Sasaki R, Kohmura E. Diagnostic value of glutamate with 2-hydroxyglutarate in magnetic resonance spectroscopy for IDH1 mutant glioma. Neuro Oncol. 2016 Nov;18(11):1559-1568. doi: 10.1093/neuonc/now090. Epub 2016 May 5. PMID: 27154922; PMCID: PMC5063515.
- Tahsini MR, Wylezinska-Arridge M, Zare M, Saket S, Farahvash MA, Morovvati M, Rahimian E, Bisdas S. Diagnostic value of quantitative MR spectroscopy metabolite ratios for Canavan disease . Front Radiol. 2026 Jul 15;6:1826170. doi: 10.3389/fradi.2026.1826170. PMID: 42529236; PMCID: PMC13416435.
- Kim JH, Chang KH, Na DG, Song IC, Kim SJ, Kwon BJ, Han MH. Comparison of 1.5T and 3T 1H MR spectroscopy for human brain tumors. Korean J Radiol. 2006 Jul-Sep;7(3):156-61. doi: 10.3348/kjr.2006.7.3.156. PMID: 16969044; PMCID: PMC2667596.
- Gonen O, Gruber S, Li BS, Mlynárik V, Moser E. Multivoxel 3D proton spectroscopy in the brain at 1.5 versus 3.0 T: signal-to-noise ratio and resolution comparison . AJNR Am J Neuroradiol. 2001 Oct;22(9):1727-31. PMID: 11673168; PMCID: PMC7974443.
- Goel V, Joseph L, Dash D, Agarwal S, Garg A. Single Ring-Enhancing Lesion with the Lipid Peak on MR Spectroscopy . Ann Indian Acad Neurol. 2022 Mar-Apr;25(2):265-266. doi: 10.4103/aian.aian_604_21. Epub 2022 Mar 10. PMID: 35693691; PMCID: PMC9175415.
- Majós C, Julià-Sapé M, Alonso J, Serrallonga M, Aguilera C, Acebes JJ, Arús C, Gili J. Brain tumor classification by proton MR spectroscopy: comparison of diagnostic accuracy at short and long TE. AJNR Am J Neuroradiol. 2004 Nov-Dec;25(10):1696-704. PMID: 15569733; PMCID: PMC8148728.
- Joyner, David A MD, Chair, Early, Heather MD, Aiken, Ashley H MD, and Newell, Mary S MD, Chair. 2024. ACR–ASNR–SPR Practice parameter for the performance and interpretation of magnetic resonance spectroscopy of the central nervous system.
- Weinberg BD, Kuruva M, Shim H, Mullins ME. Clinical Applications of Magnetic Resonance Spectroscopy in Brain Tumors: From Diagnosis to Treatment. Radiol Clin North Am. 2021 May;59(3):349-362. doi: 10.1016/j.rcl.2021.01.004. Epub 2021 Mar 23. PMID: 33926682; PMCID: PMC8272438.